

Access system logs (Loki) via Grafana
Below is a step-by-step walkthrough of how to view JupyterHub pod logs in Grafana Loki. As similar approach can be used to find other commonly accessed logs (summarized at the end of this document).
To view the Loki logs via Grafana in Nebari, you'll need to have set up monitoring on your deployment.
Getting Started
Section titled “Getting Started”Access the Monitoring UI for your Nebari installation at <https://{your-nebari-domain}/monitoring/>.
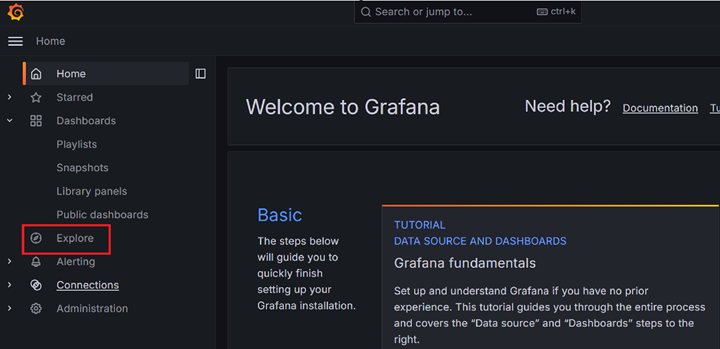
First, click "Explore".
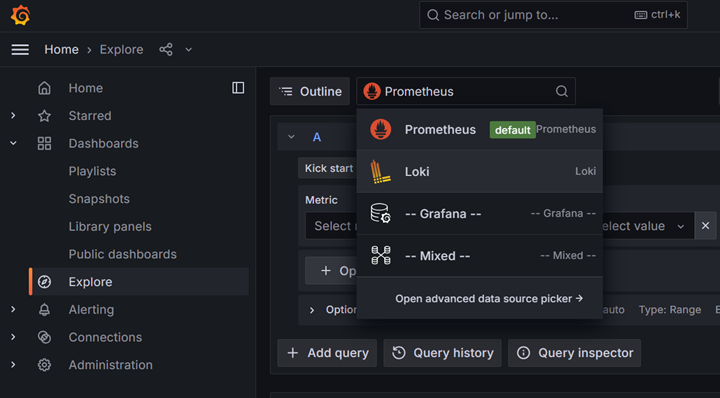
Select Loki as the data source at the top:
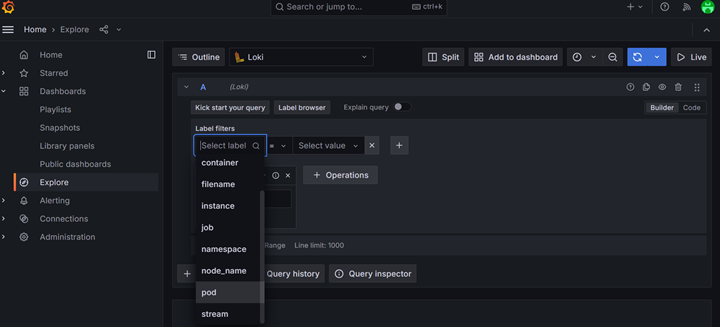
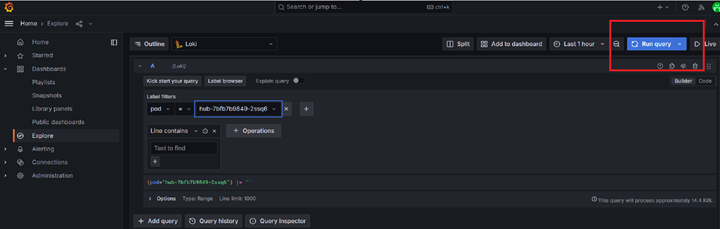
Select a Label to search. For this example, we will select pod:
Begin typing the name of the desired pod. In this case we are looking
for a JupyterHub pod. The exact name will vary on each deployment but it will begin with hub- followed by a unique identifier.
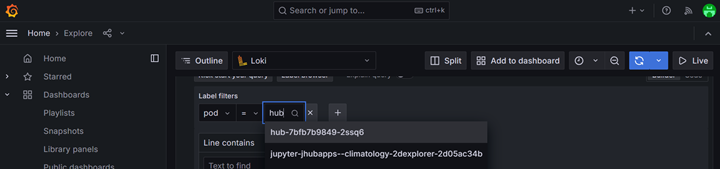
Select the pod from the list of pods and then click on "Run Query":
After clicking on "Run Query", you should be able to see logs for JupyterHub pod as shown below:
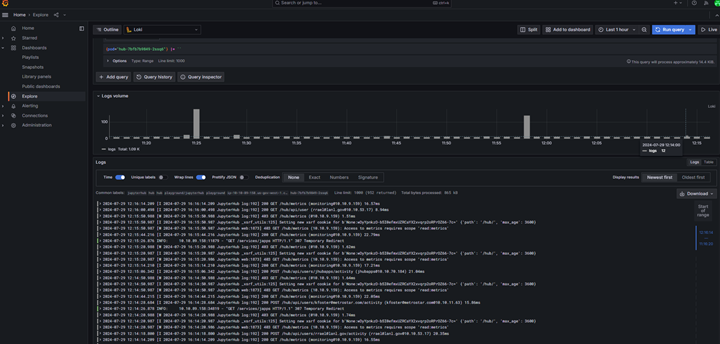
You can also filter by time by clicking on the time filter on top right (next to "Run query").
Common Queries
Section titled “Common Queries”The approach above can be used to access a wide variety of logs on Nebari. Below are some common queries.
JupyterLab Server Logs
Section titled “JupyterLab Server Logs”Each user will have their own JupyterLab instance (which may or may not be running at any given time) which will contain its own set of logs. To view the logs for a JupyterLab server, use pod label and begin typing the username of interest. The pod name will be jupyter-{username}.
Conda-Store Logs
Section titled “Conda-Store Logs”Conda-store runs multiple pods on the backend. The conda-store server runs continuously while conda-store-workers are only started when an environment is being built. Therefore, worker pods may not always exist. Generally, user requests and access logs will be in the server pod, while logs related to environment builds will be in a worker pod. In the list of conda-store pods shown below, you'll also see pods for minio, postgresql, and redis. These are used internally by conda-store are not likely to have any logs of interest.
nebari-conda-store-server-[id]nebari-conda-store-worker-[id]nebari-conda-store-minio-[id]nebari-conda-store-postgresql-postgresql-0nebari-conda-store-redis-master-0
Deployed app logs (via jhub-apps)
Section titled “Deployed app logs (via jhub-apps)”If you have jhub-apps enabled on your deployment, you can view the logs to debug deployed apps.
To see the logs from all deployed apps, use the label filter container = notebook. The main container in each deployed app pod is named notebook.
To see logs from a specific app, use the pod label and begin typing either the name of the user running the app or the app name to find the correct pod. App pods are named with the convention jupyter-[username]--[app_name]-[pod_id].
Programmatic Access to Logs
Section titled “Programmatic Access to Logs”Grafana logs can be accessed programmatically from within a Jupyter Notebook or JupyterHub App running in Nebari:
- Create a Grafana Service Account and API token by following Grafana docs: https://grafana.com/docs/grafana/latest/administration/service-accounts/
- Use example code below to retrieve logs from a specific Loki Data Source UID:
import requestsfrom datetime import datetime, timedeltaimport requestsimport json
NEBARI_BASE_URL = "<URL>" # Your Nebari URL e.g. https://nebari.localGRAFANA_TOKEN = "<Token>" # e.g. "glsa_4QWcA...", See Grafana Documentation
headers = { "Authorization": f"Bearer {GRAFANA_TOKEN}" }
url = f'{NEBARI_BASE_URL}/monitoring/api/datasources/'response = requests.get(url, headers=headers)assert response.status_code == 200print(response.json())# Example output: [{'id': 2, 'uid': 'alertmanager', 'orgId': 1, 'name': 'Alertmanager', 'type': 'alertmanager',  ...
# Specify a Loki Data Source UID:def get_loki_uid(datasources):    for datasource in datasources:        if datasource["name"] == "Loki":          return datasource["uid"]
loki_datasource_uid = get_loki_uid(response.json())print(f"Loki data source uid: {loki_datasource_uid}")# Example output: Loki data source uid: P8E80F9AEF21F6940
# Set Up and Execute a Grafana Query:grafana_url = f'{NEBARI_BASE_URL}/monitoring'api_key = GRAFANA_TOKENloki_data_source_uid = loki_datasource_uid
# Query parametersquery = '{app="jupyterhub"}'query_url = f'{grafana_url}/api/ds/query'
headers = { 'Authorization': f'Bearer {api_key}', 'Content-Type': 'application/json' }
# Data payloadpayload = {    'queries': [        {            'datasource': {'uid': loki_data_source_uid},            'expr': query,            'refId': 'A',            'intervalMs': 100,            'maxDataPoints': 1        }    ],    "from":"now-5m",   "to":"now"}
# Send the requestresponse = requests.post(query_url, headers=headers, data=json.dumps(payload))
# Print the responseif response.status_code == 200:    data = response.json()    print(json.dumps(data["results"]["A"], indent=2))else:    print(f'Error: {response.status_code}, {response.text}')