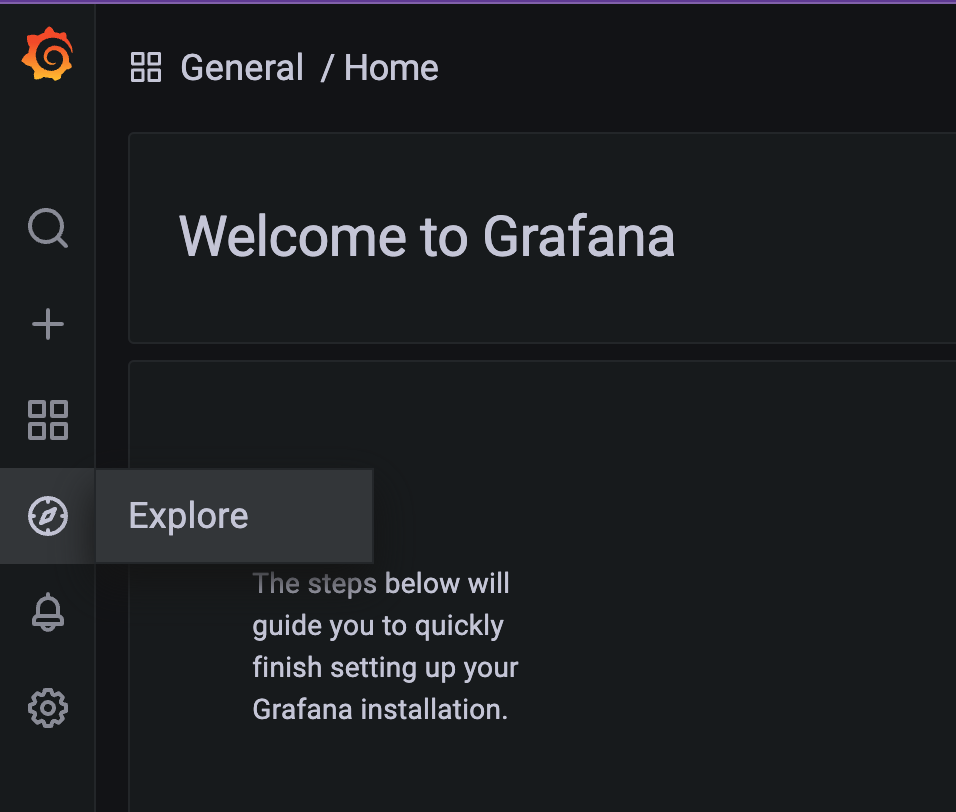
Monitoring
In Nebari, we've integrated Grafana, Prometheus, and Loki to provide robust monitoring capabilities for your data science platform. This integration allows you to visualize metrics, monitor system health, and analyze logs effectively. Below, we'll discuss each component and how they are deployed using Helm charts, along with instructions on how to override configuration values.
Monitoring is enabled by default in Nebari. It can be disabled by setting the following in your nebari-config.yaml.
monitoring:
  enabled: false
Components Overview
Grafana
Grafana is a leading open-source platform for monitoring and observability. It provides rich visualization tools and dashboards for analyzing and monitoring metrics from various data sources.
Prometheus
Prometheus is a popular open-source monitoring and alerting toolkit. It collects metrics from configured targets, stores them efficiently, and allows querying them in real-time.
Loki
Loki is a horizontally-scalable, highly available, multi-tenant log aggregation system inspired by Prometheus. It is designed to be very cost-effective and easy to operate, as it does not index the contents of the logs, but rather a set of labels for each log stream. Below is a step-by-step walkthrough of how to view JupyterHub pod logs in Grafana Loki:
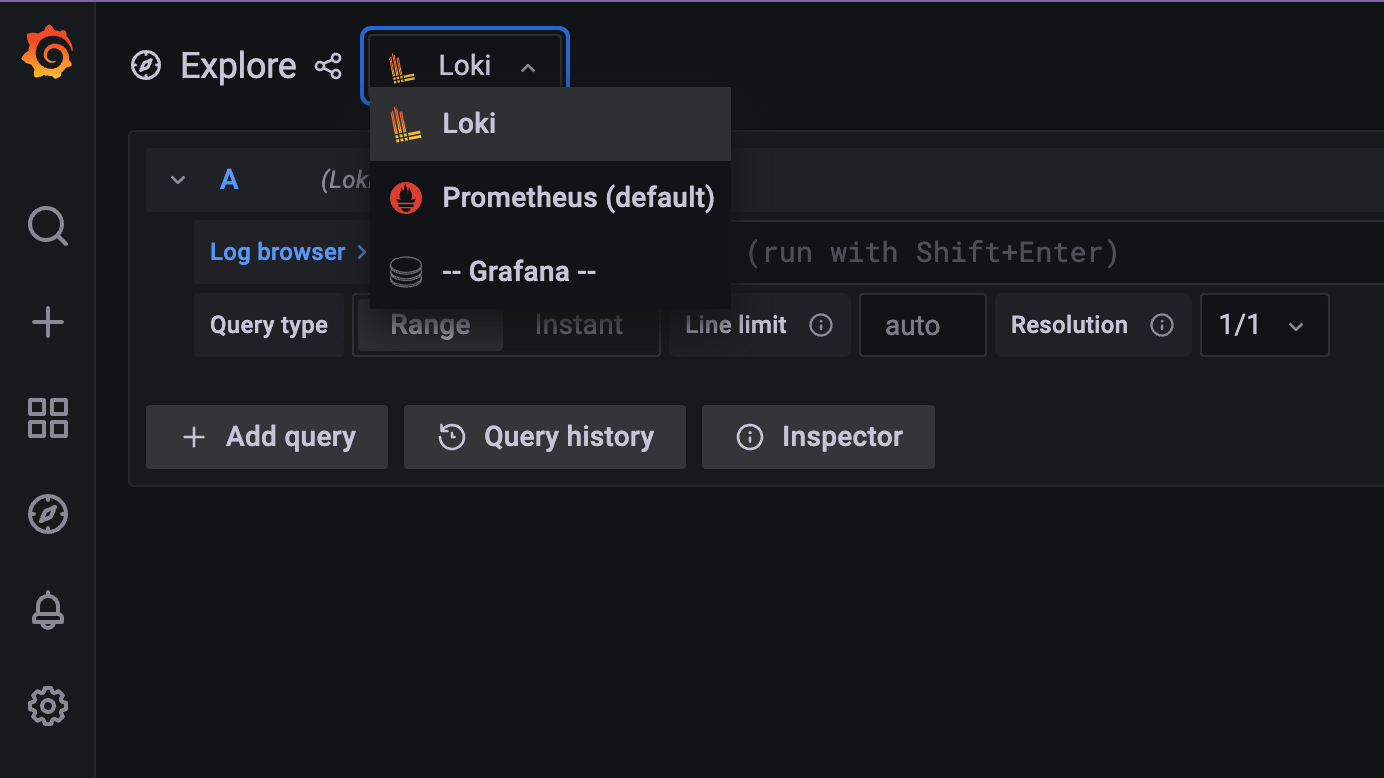
Go to explore section of monitoring of your Nebari installation at:
https://{your-nebari-domain}/monitoring/
Select Loki Data source at the top:
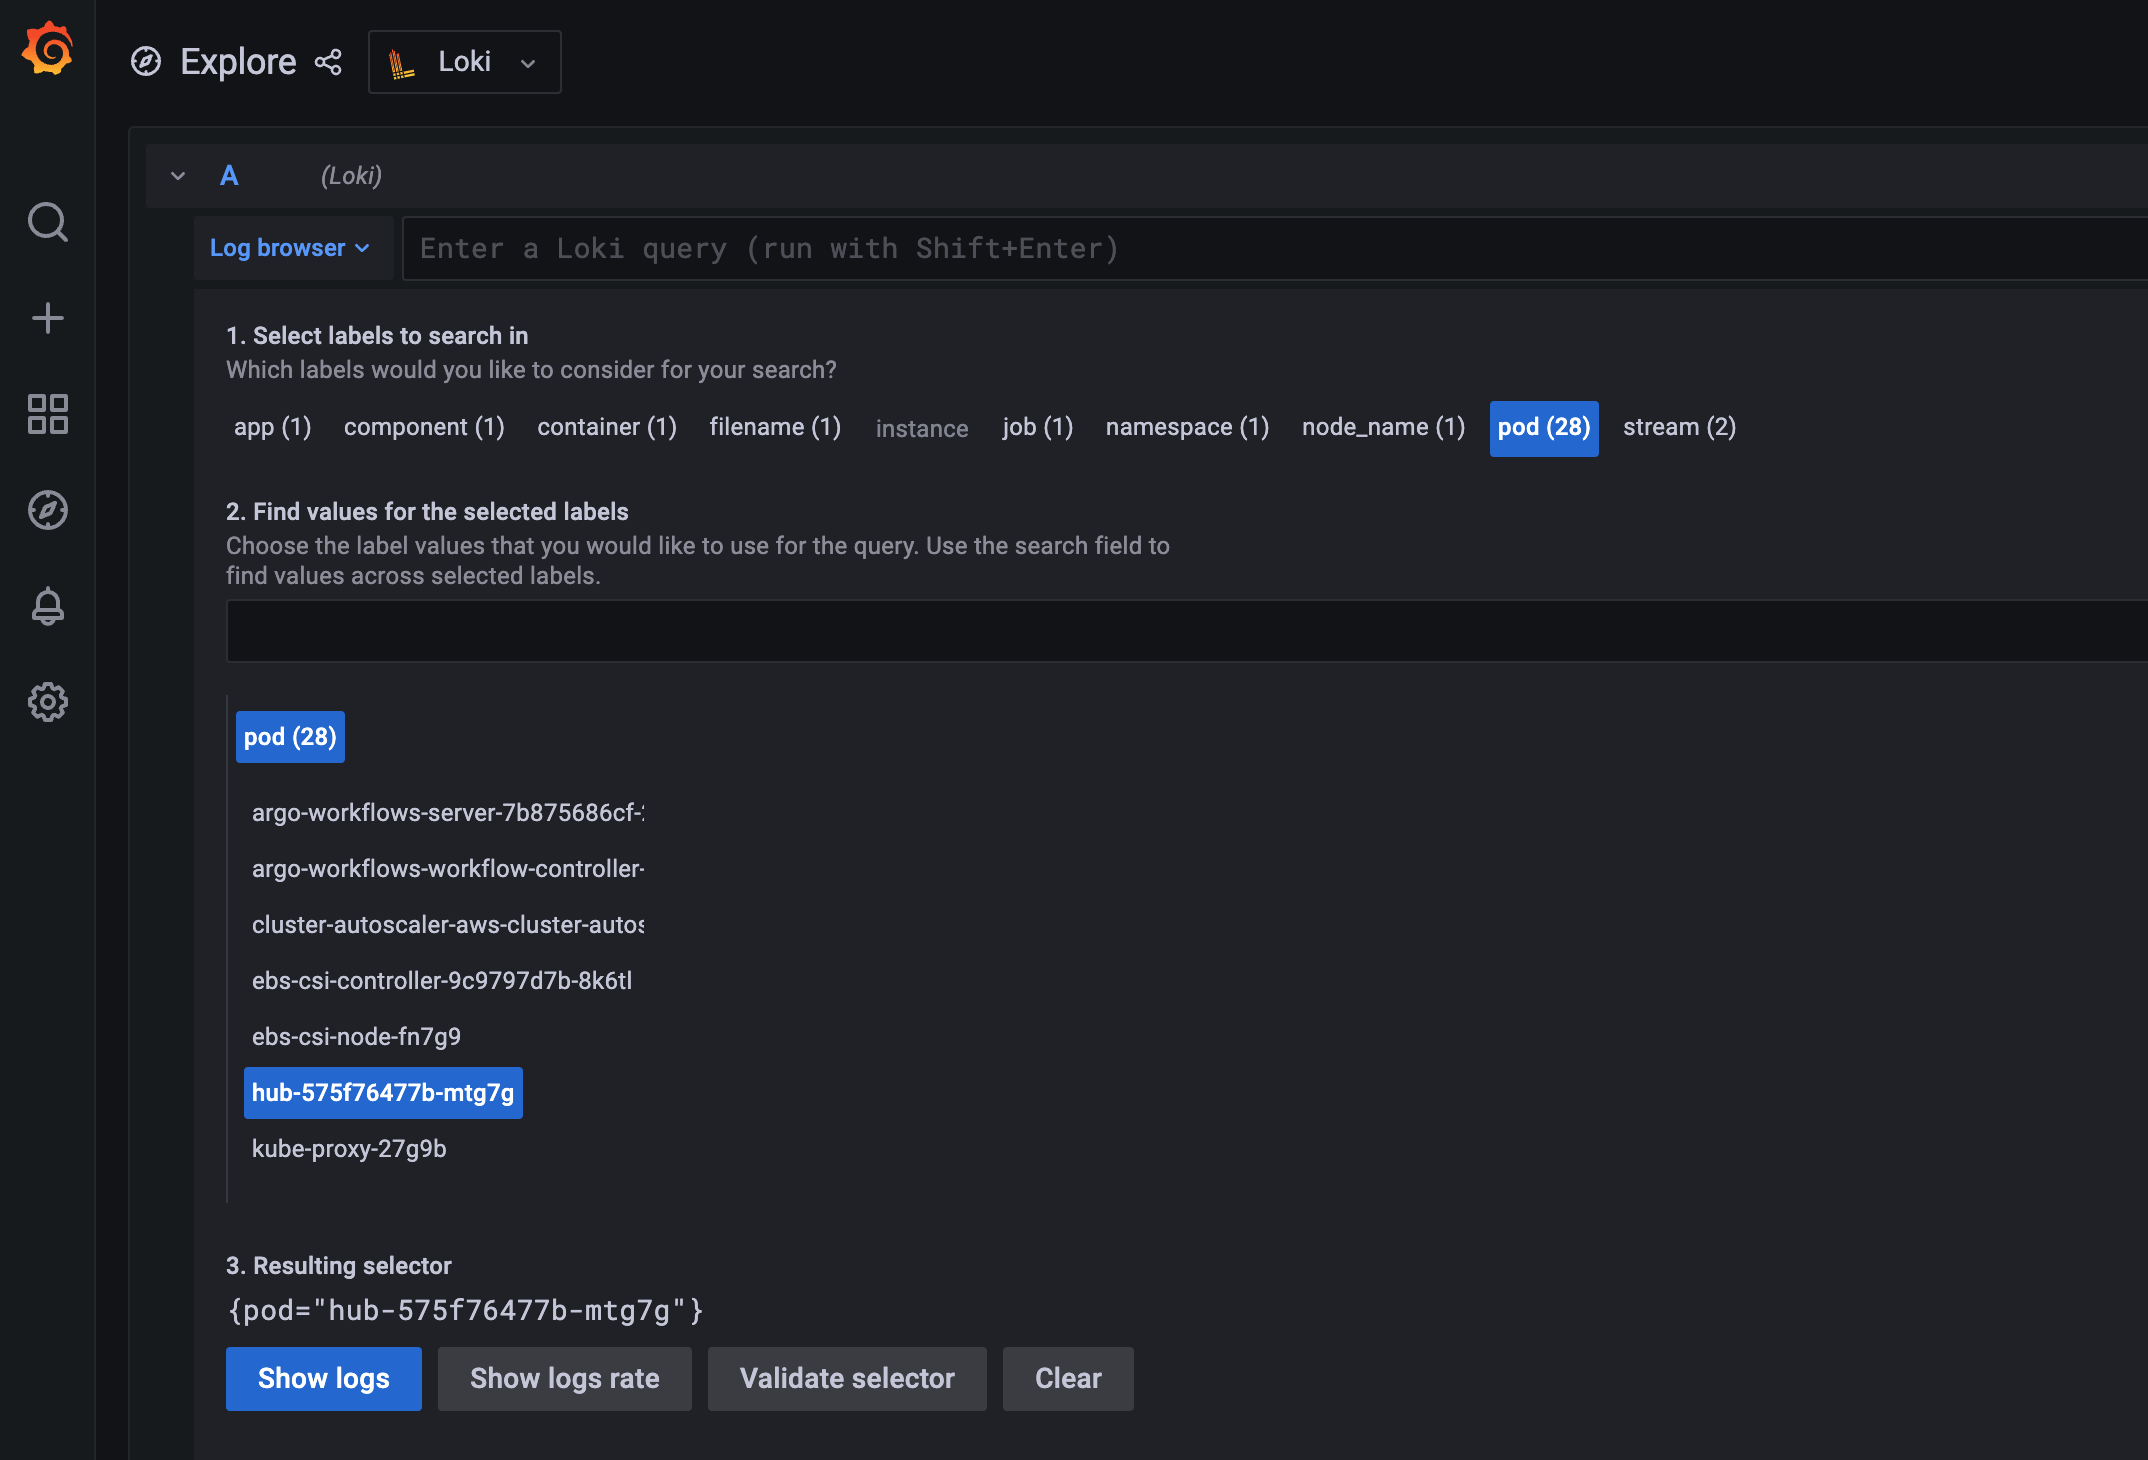
Click on the Log browser and select labels to search in, in this case we have selected pod:
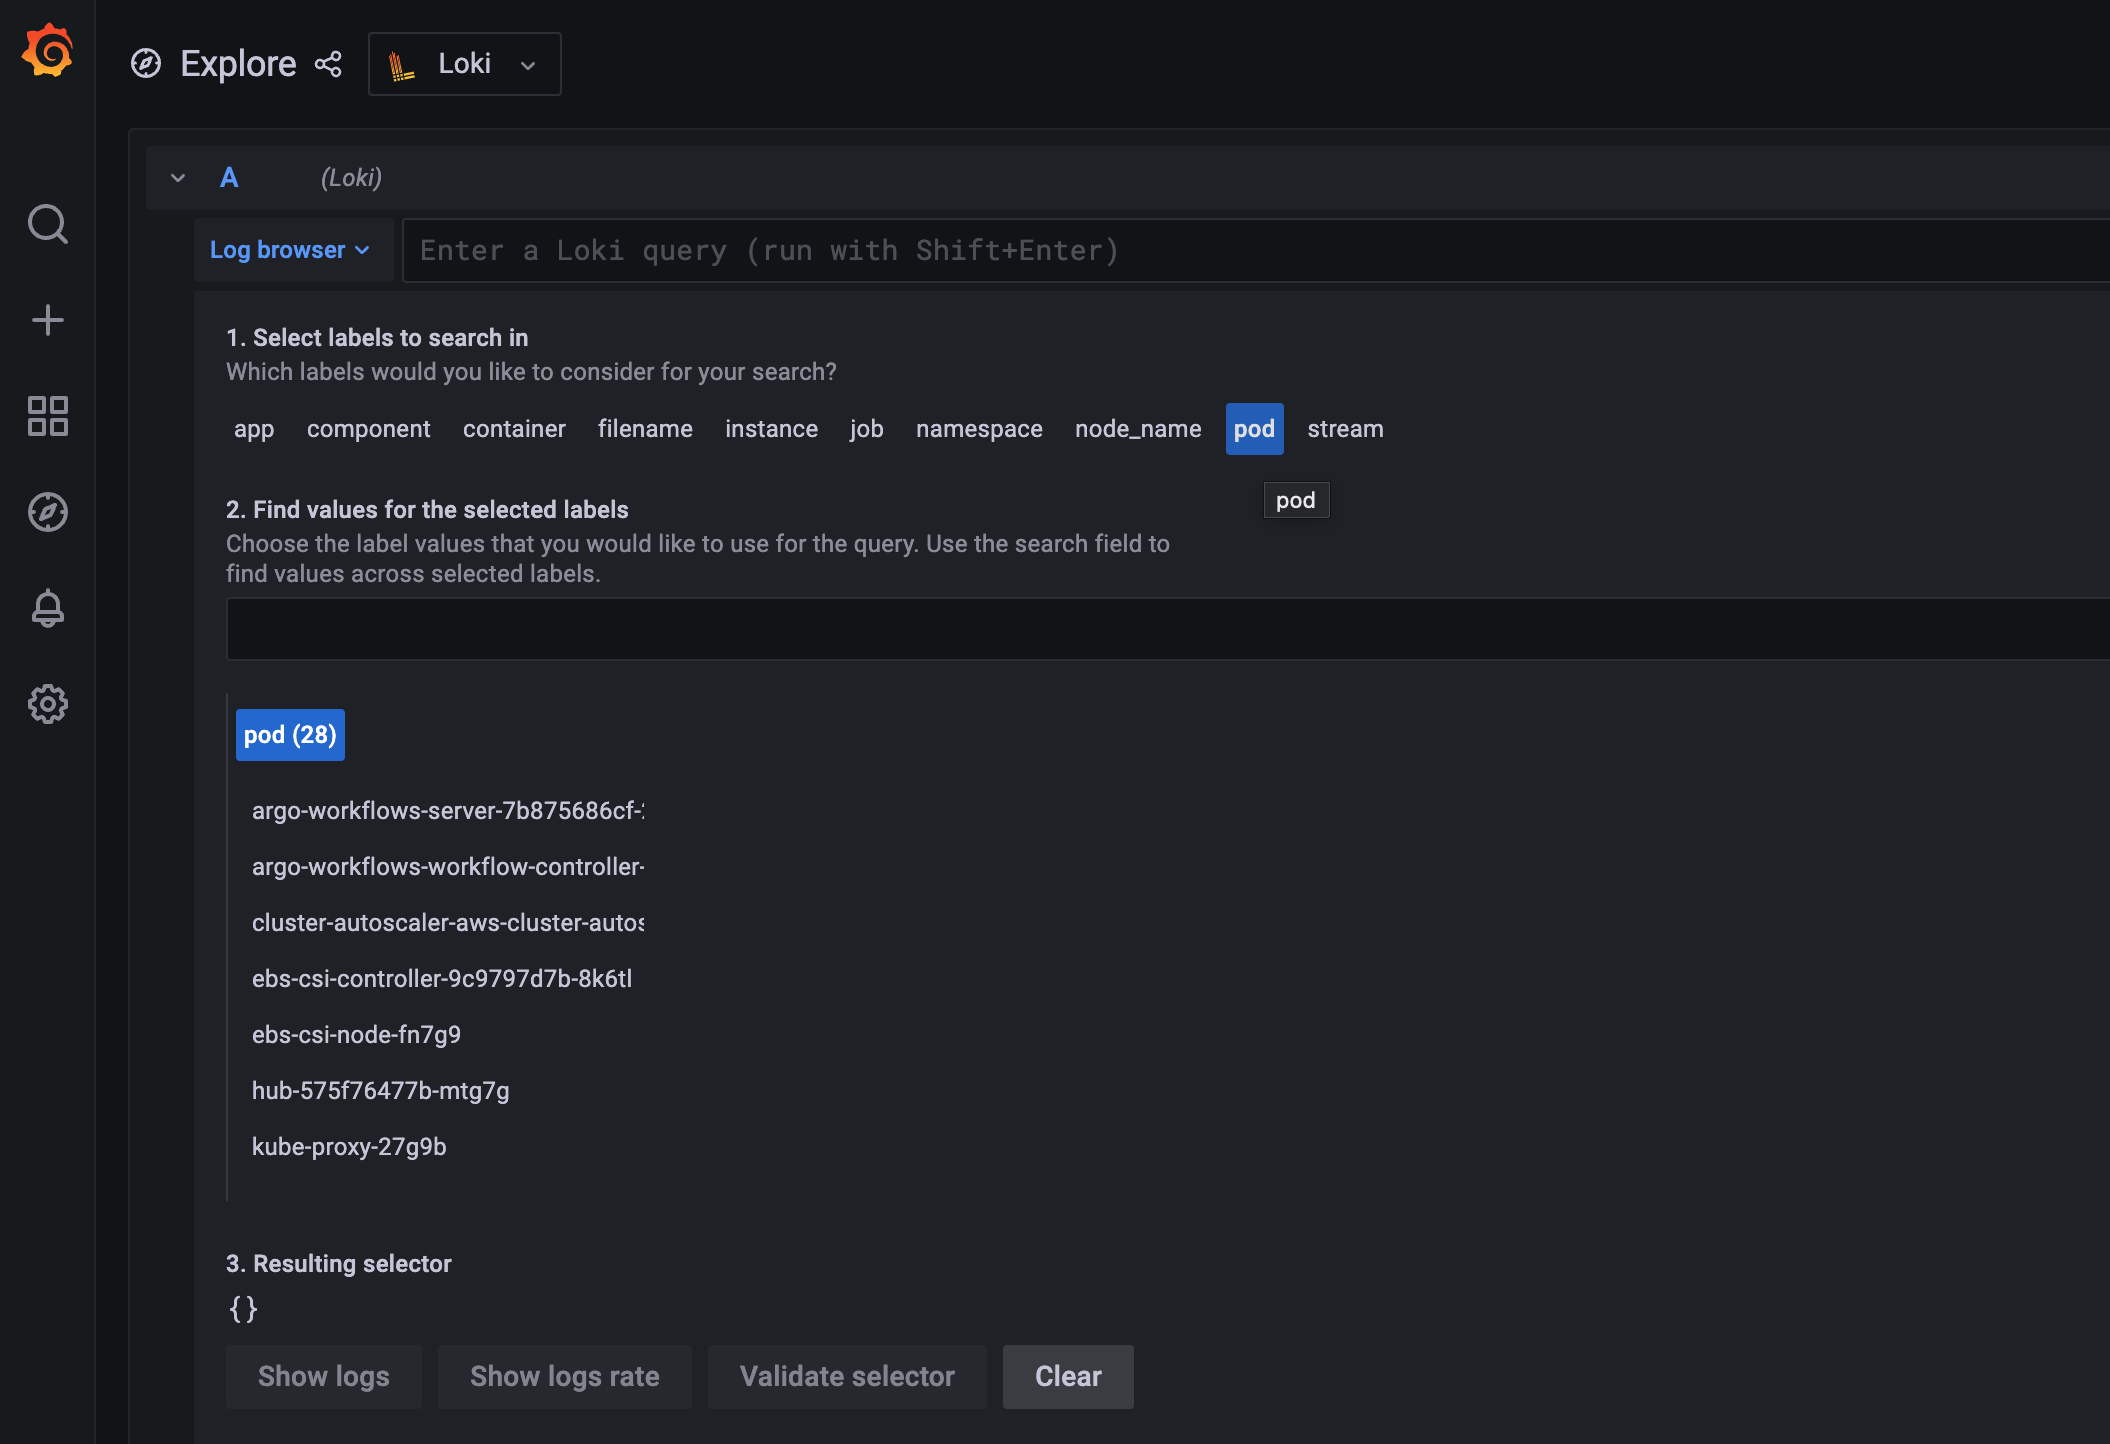
Type the pod name initials for the pod you're looking to search logs for, in this case we are looking for hub pod:
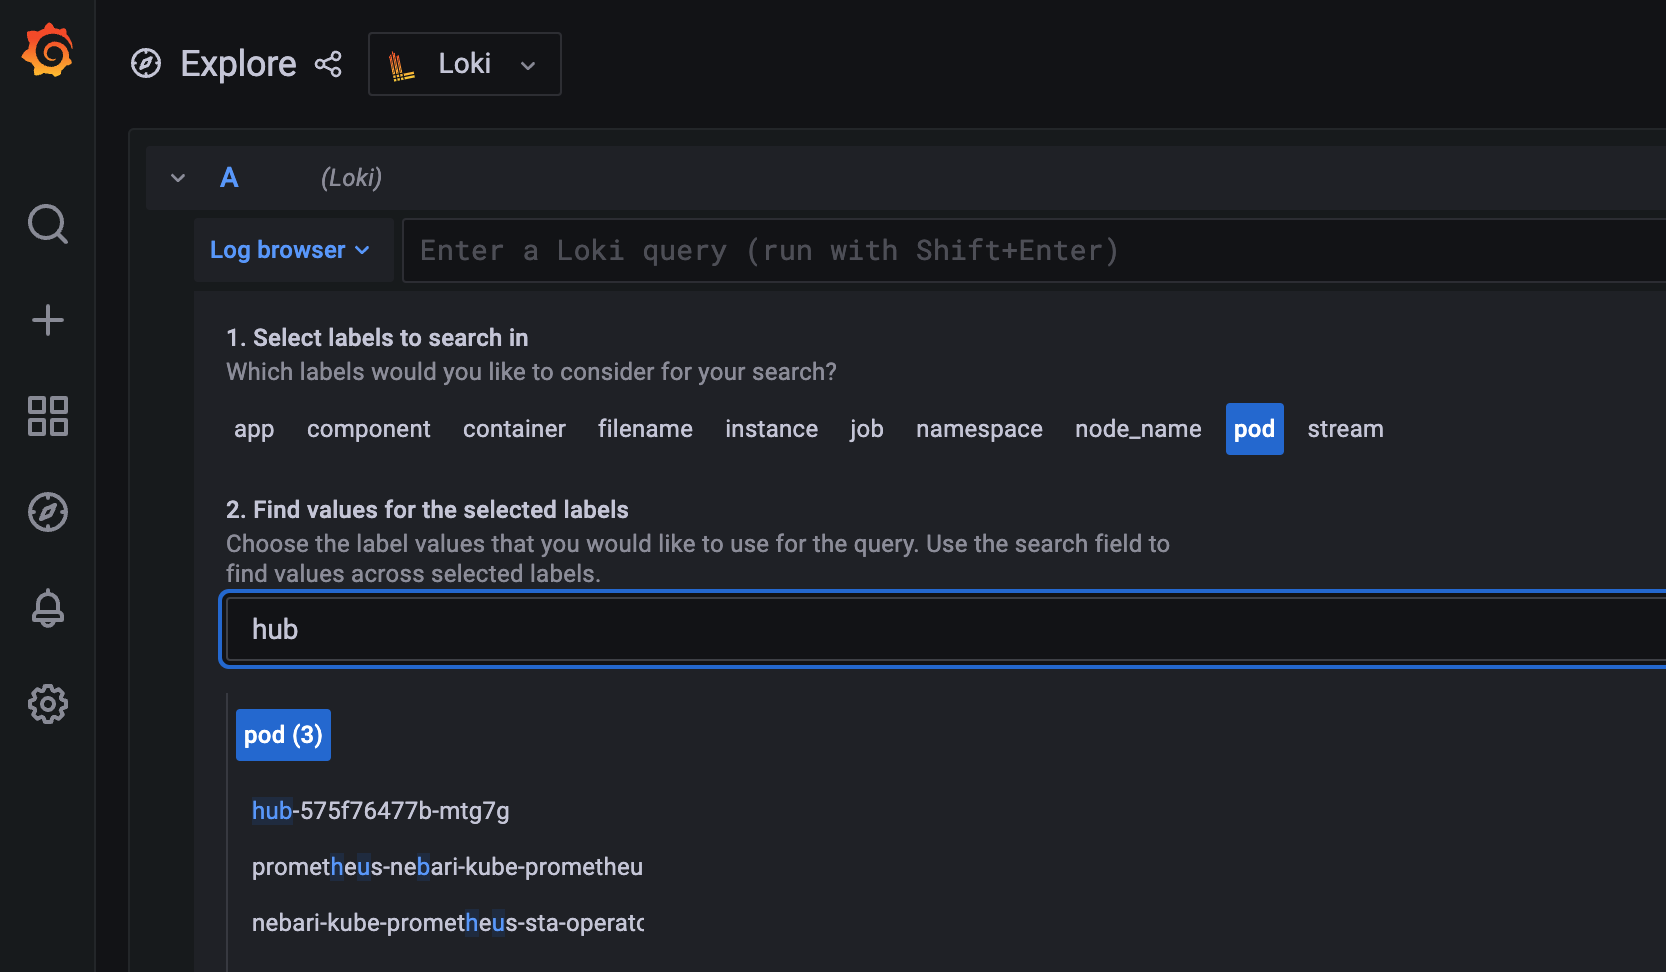
Select the pod from the list of pods and then click on "Show logs":
After clicking on "Show logs", you should be able to see logs for JupyterHub pod as shown below:
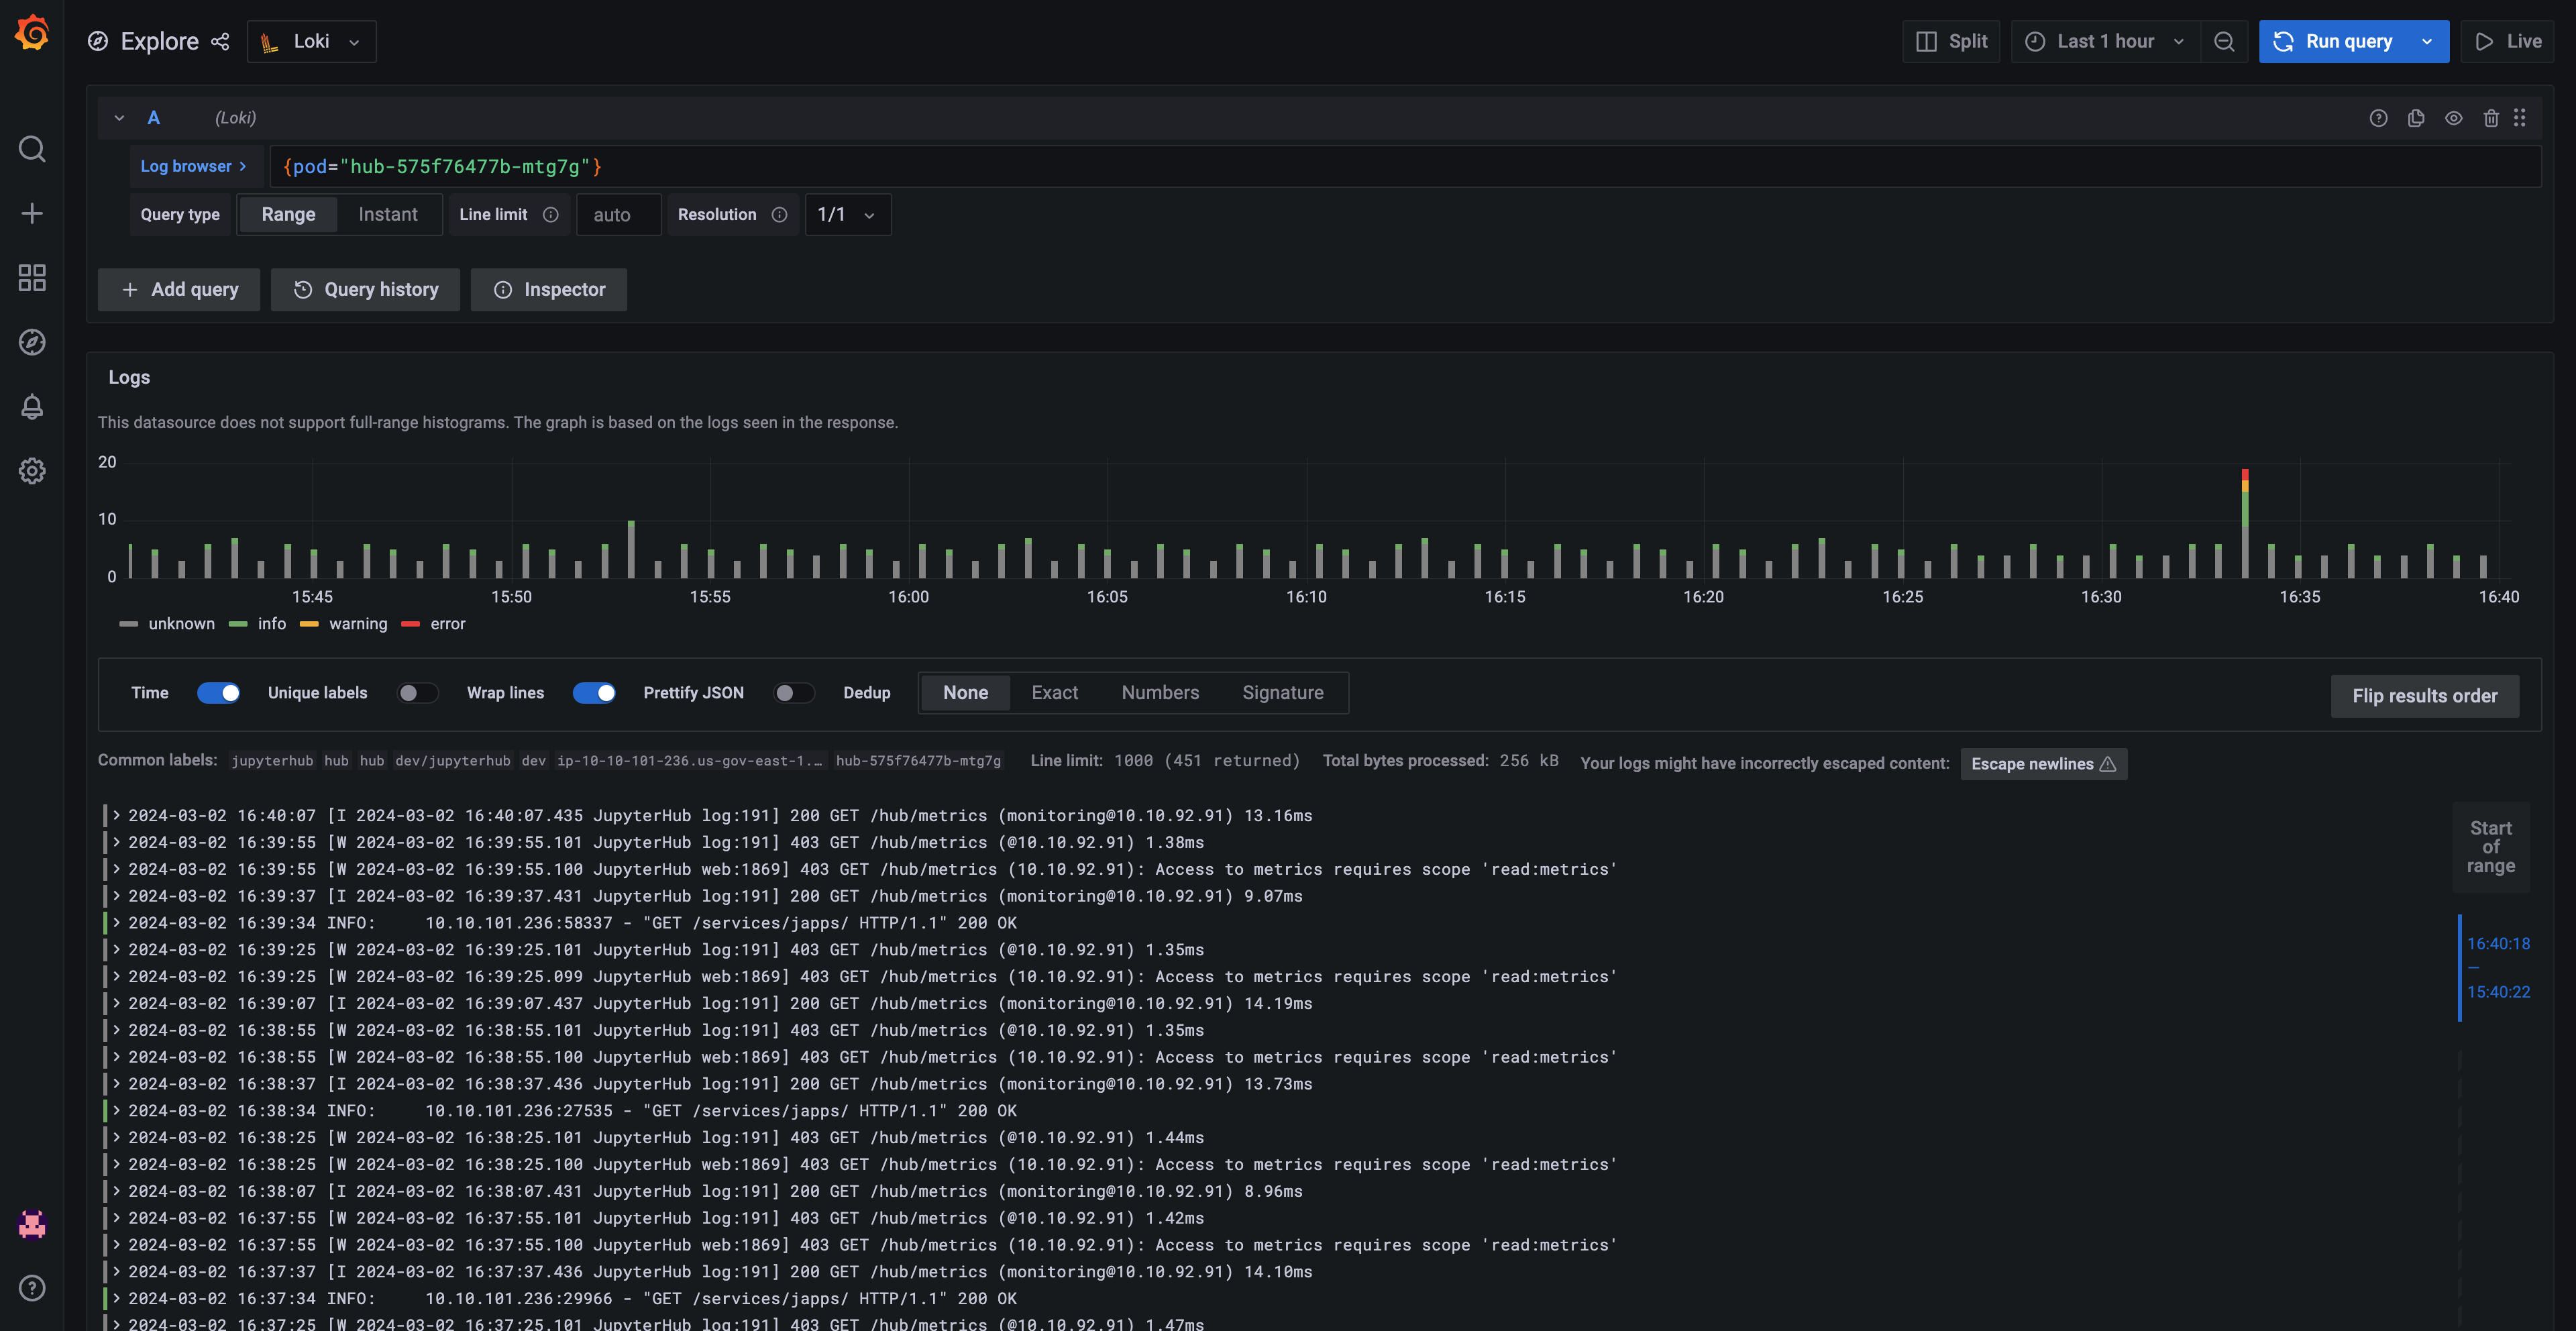
You can also filter by time, by clicking on the time filter on top right, next to "Run query".
Terraform Overrides
Nebari provides its users with the ability to customize the deployment of various component and Loki is one of them. Loki deployment is made up of three fundamental components:
- Loki: a set of components that when composed forms a fully featured logging stack
- Promtail: an agent which ships the contents of local logs to a Loki instance
- MinIO: a Kubernetes-native high-performance object storage server which is designed for large-scale private cloud infrastructure and compatible with Amazon S3.
monitoring:
  enabled: true
  overrides:
    loki: <LOKI-HELM-CHART-VALUES-OVERRIDE>
    promtail: <PROMTAIL-HELM-CHART-VALUES-OVERRIDE>
    minio: <MINIO-HELM-CHART-VALUES-OVERRIDE>
Below are some examples of customizing your loki deployment via terraform overrides:
Log Storage Config
We use minio for logs storage as default, it is a high-performance, S3 compatible object store. You can use any S3 compatible object store instead of minio, below is an example configuration for using AWS S3:
monitoring:
  enabled: true
  minio_enabled: false
  overrides:
    loki:
      loki:
        storage_config:
          aws:
            s3: s3://<access_key>:<uri-encoded-secret-access-key>@<region>
See https://grafana.com/docs/loki/latest/storage/#aws-deployment-s3-single-store for more configuration options.
Log Storage
You can customize the size of persistent volume for logs storage, by setting up the value for
minio.persistence.size as shown below:
monitoring:
  enabled: true
  overrides:
    minio:
      persistence:
        size: 100Gi
Log Retention Period
Since the storage for MinIO is predefined and is not infinitely scalable out-of-the-box like cloud storage solutions like S3, GCS, etc, unless you keep increasing minio persistent volume size. It is a good idea to clear up old logs to make space for new ones, Nebari does this by default with 60 days retention period. You can customize the log retention period by overriding the default value as follows:
monitoring:
  enabled: true
  overrides:
    loki:
      loki:
        limits_config:
          # The minimum retention period is 24h.
          retention_period: 90d
This may not be a suitable solution for many cases, like if your organization needs to keep all the logs forever, then you may want to use a very large persistent volume and disable deletion of old logs. You can disable deletion via:
monitoring:
  enabled: true
  overrides:
    loki:
      loki:
        compactor:
          retention_enabled: false