Using Visual Studio (VS) Code
Using VS Code as your development environment
VS Code can be used as an IDE (integrated development environment) which provides helpful tooling (including debugging) to assist developers in writing code. It also has many other functions which non-developers may also find useful such a text editing and markdown rendering.
Your VS Code server does not automatically shut down when idle. To prevent excess resource usage, be sure to manually shut down your server. More details are available in this FAQ for VS Code.
Getting started
VS Code comes built-in with every installation of Nebari. To start, log in to Nebari and spin up a JupyterLab instance.
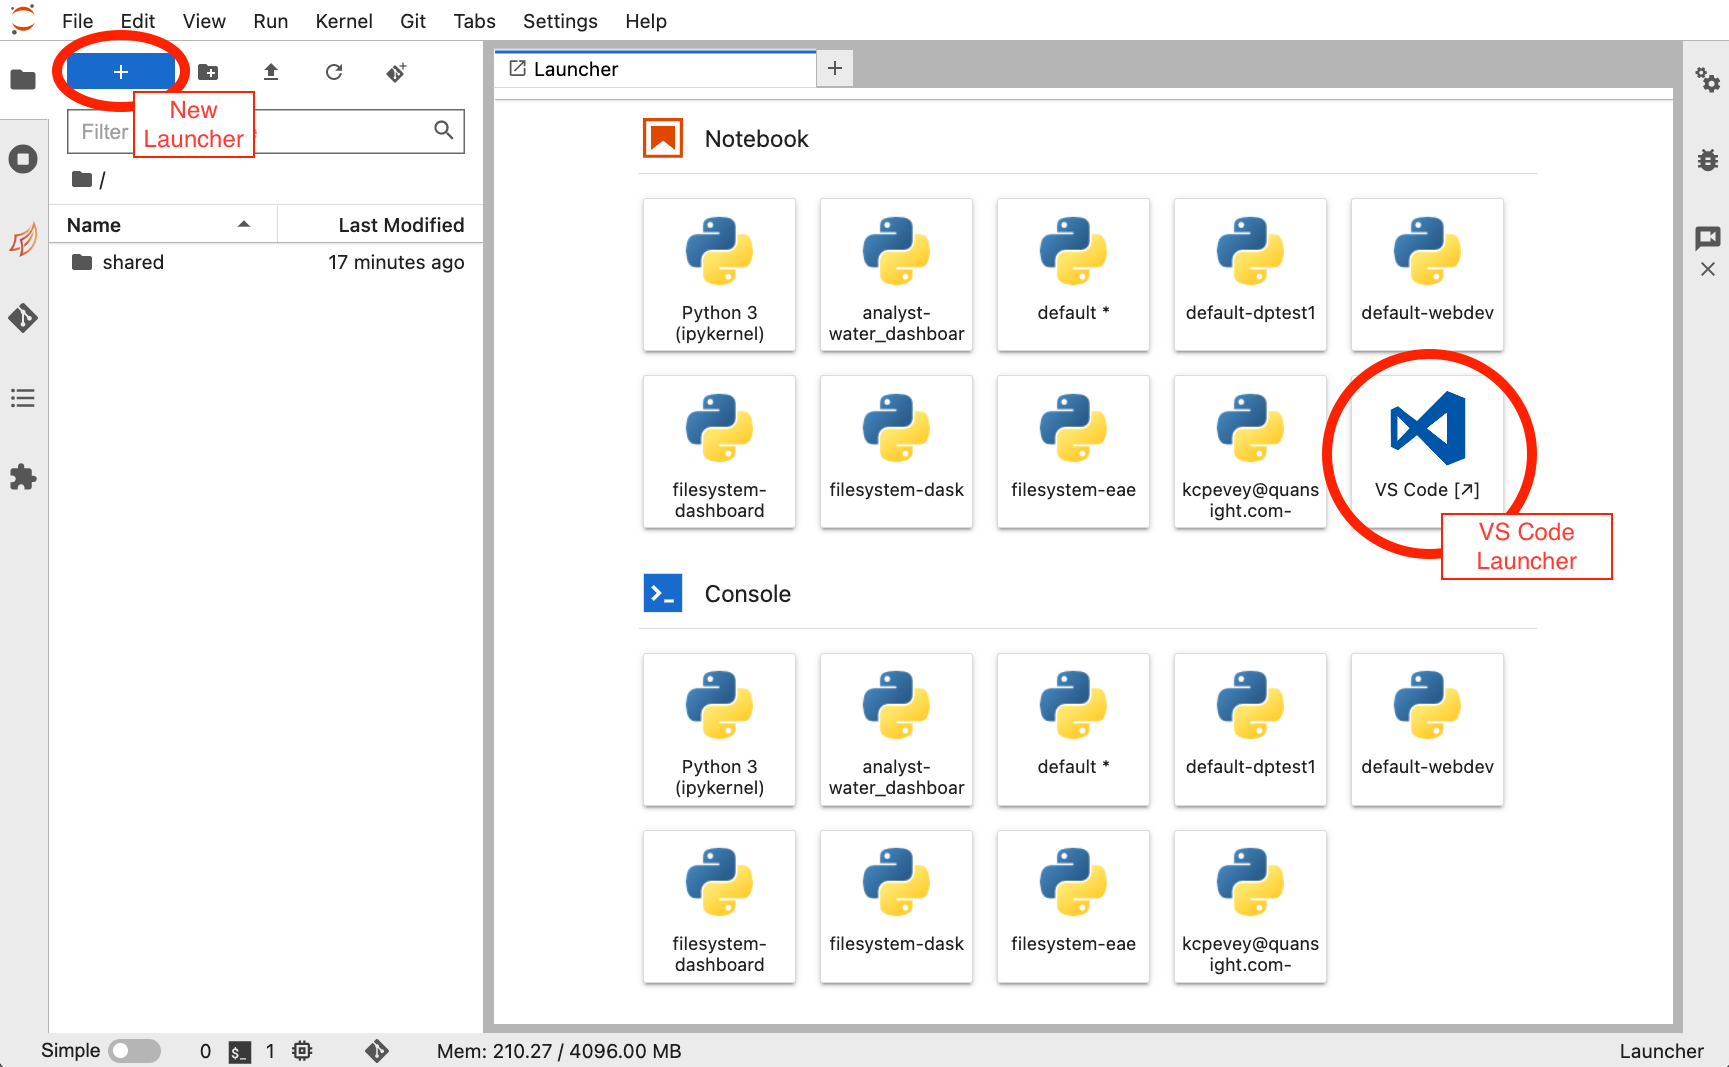
Next, bring up the New Launcher window by clicking the + in the top left of
the screen. Now click on the VS Code logo on the Launcher window.
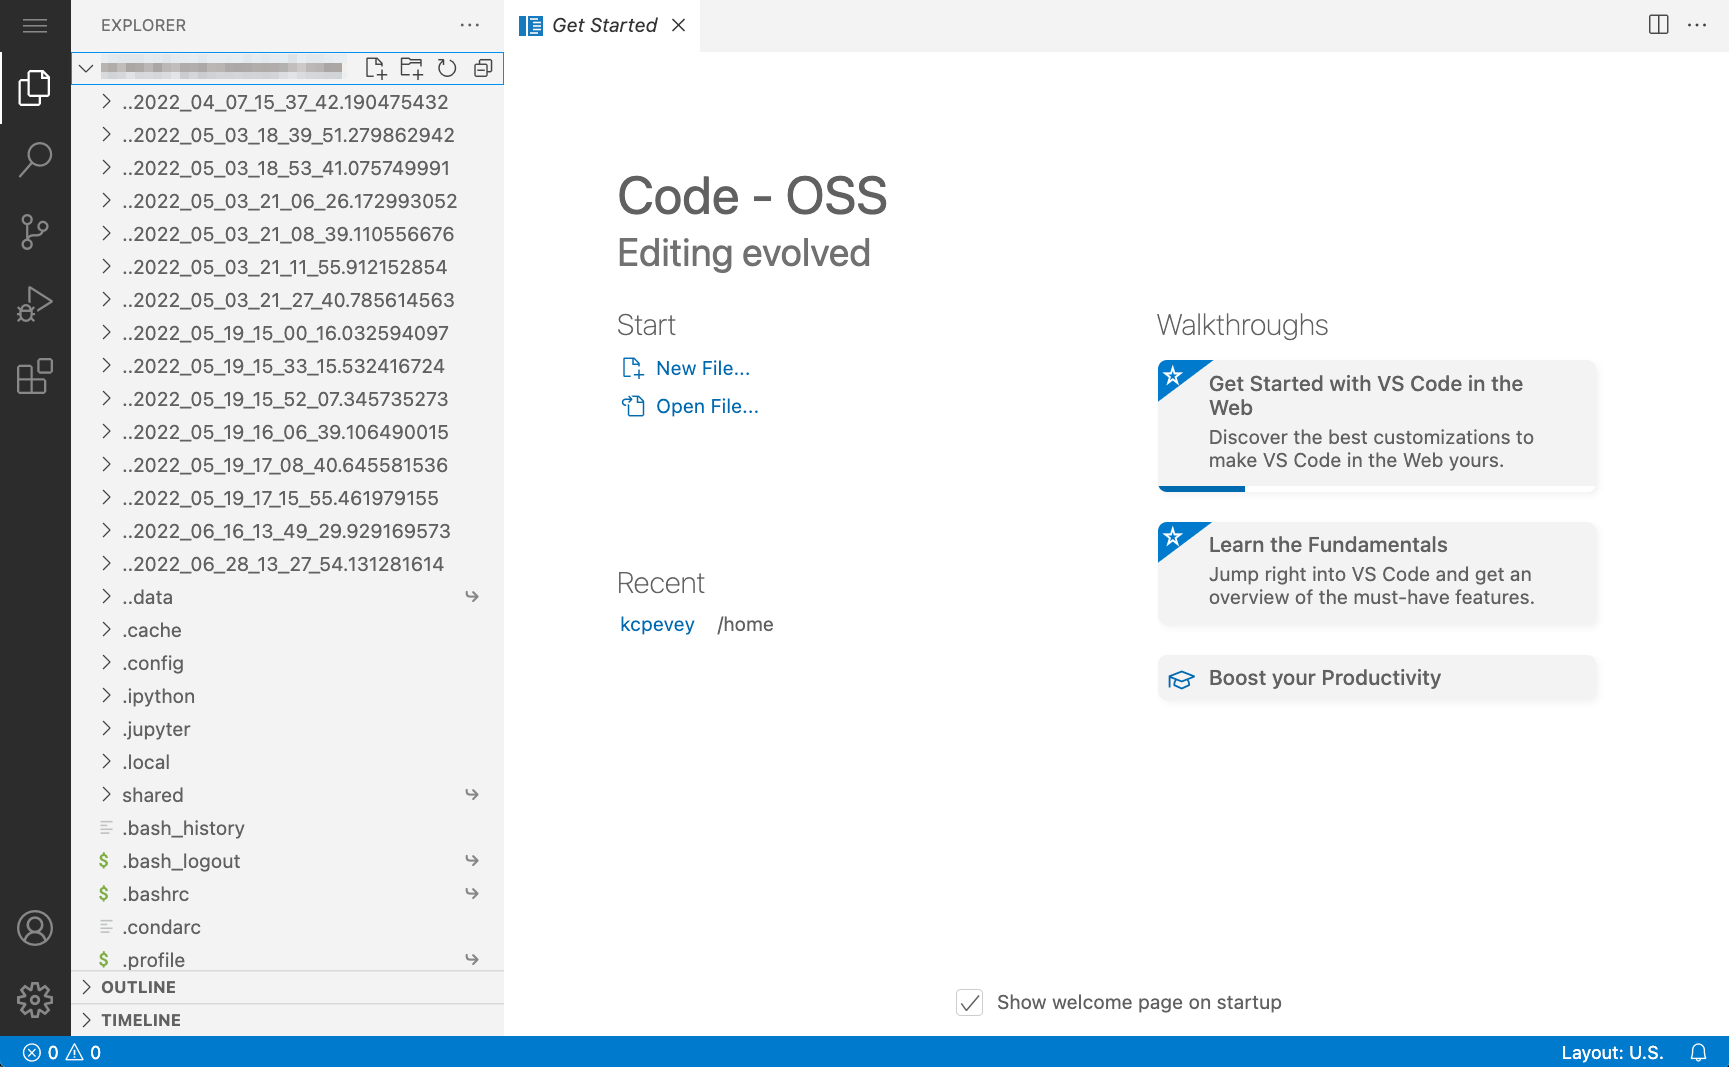
You will now have been redirected to a new web browser page showing the VS Code platform. If you're starting VS Code for the first time, you'll see a Welcome Page with some helpful links and tips.
Feel free to explore!
VS Code components
On the far left, you'll see the Activity Bar in black. Also, on the left is
the Explorer. As you click on the items in the Activity Bar, the Explorer
items will update.
Let's review some of the most useful features.
The Activity Bar components
The Activity Bar is where you'll go to switch between the main tools
available in VS Code. Below is a brief overview of the icons on the
Activity Bar (adding extensions may add additional icons to your menu).
| Icon | Name | Description |
|---|---|---|
| File Menu | Like every other file menu - create files, run files, edit preferences... | |
 | File Explorer | View list of files, navigate folder structures |
 | Search | Search for words in the contents of files |
 | Source Control | Source Control Management (SCM) features (e.g. git) |
 | Debug | Run code using the debugger |
 | Extensions | Add plugins to extend VS Code functionality |
File editing
Now that we have that out of the way, let's explore!
We'll start by clicking on the File Explorer icon. The Explorer sidebar now
is updated with our file system. In our case, this is our Nebari user root
directory.
One of the first things you'll notice here is that there are a lot of files
starting with the . character. This is particularly handy because JupyterLab
hides these files in its Explorer view.
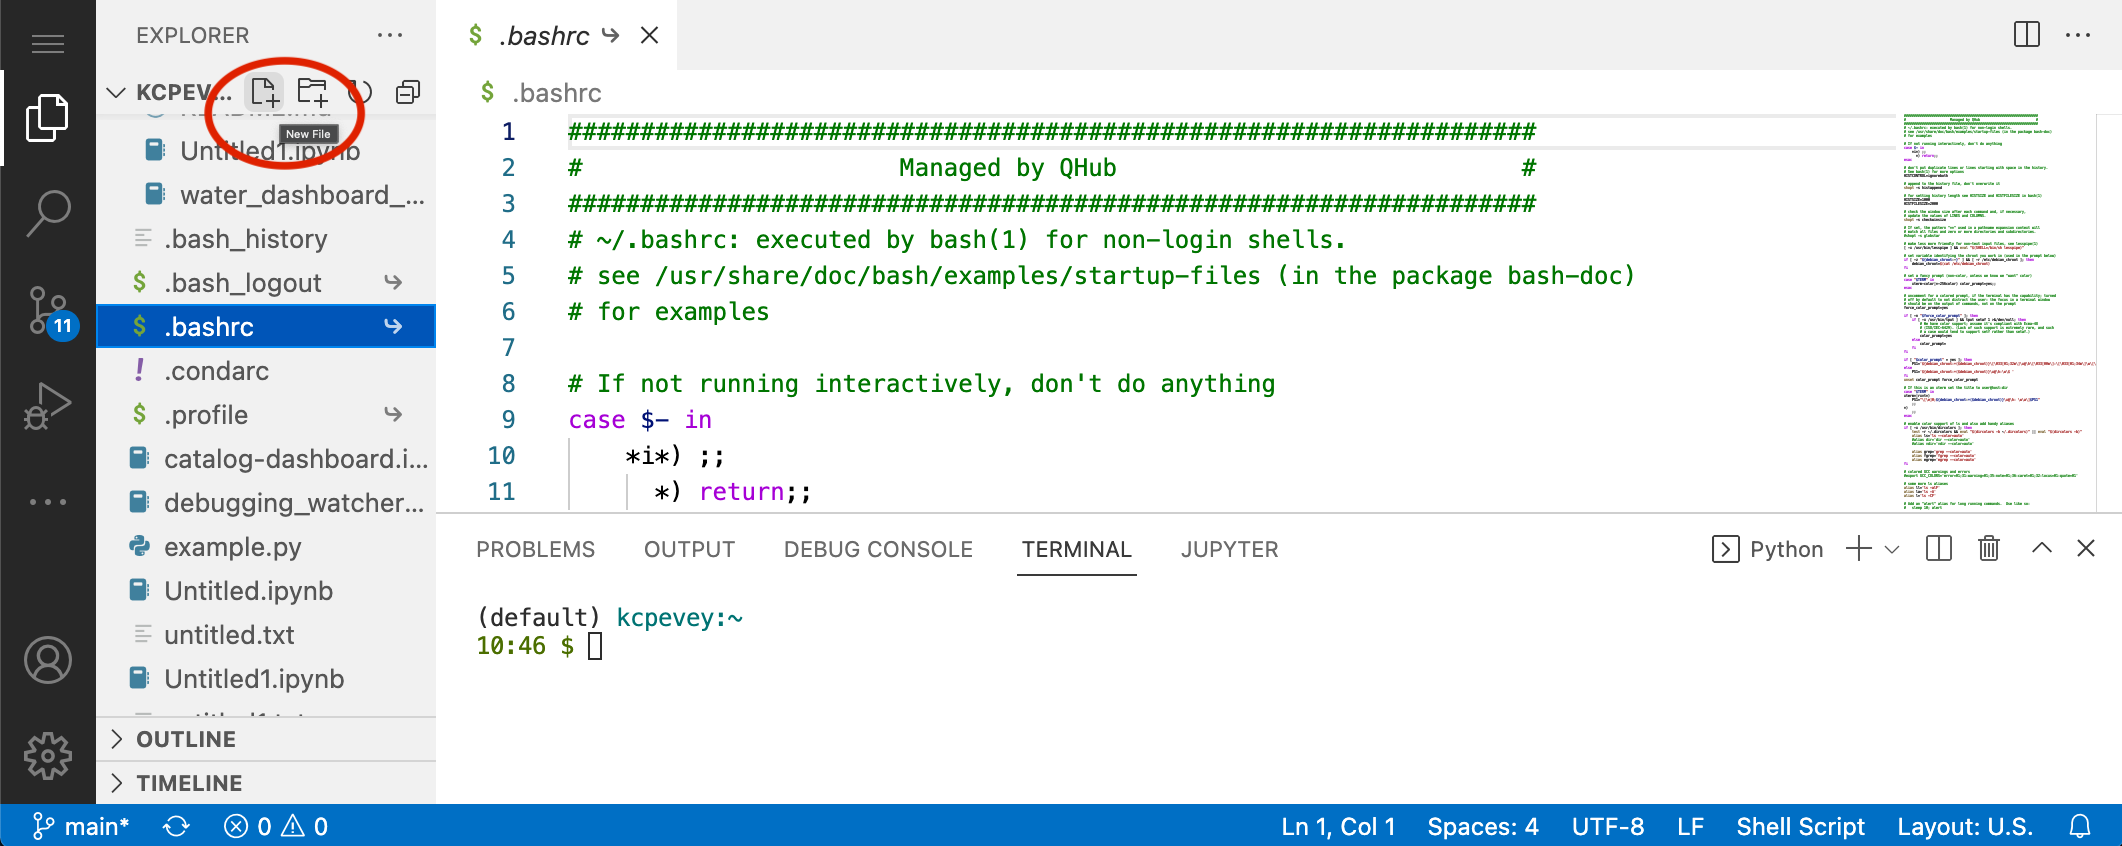
Let's click on a file we all have, .bashrc. This file was created by Nebari
for us.
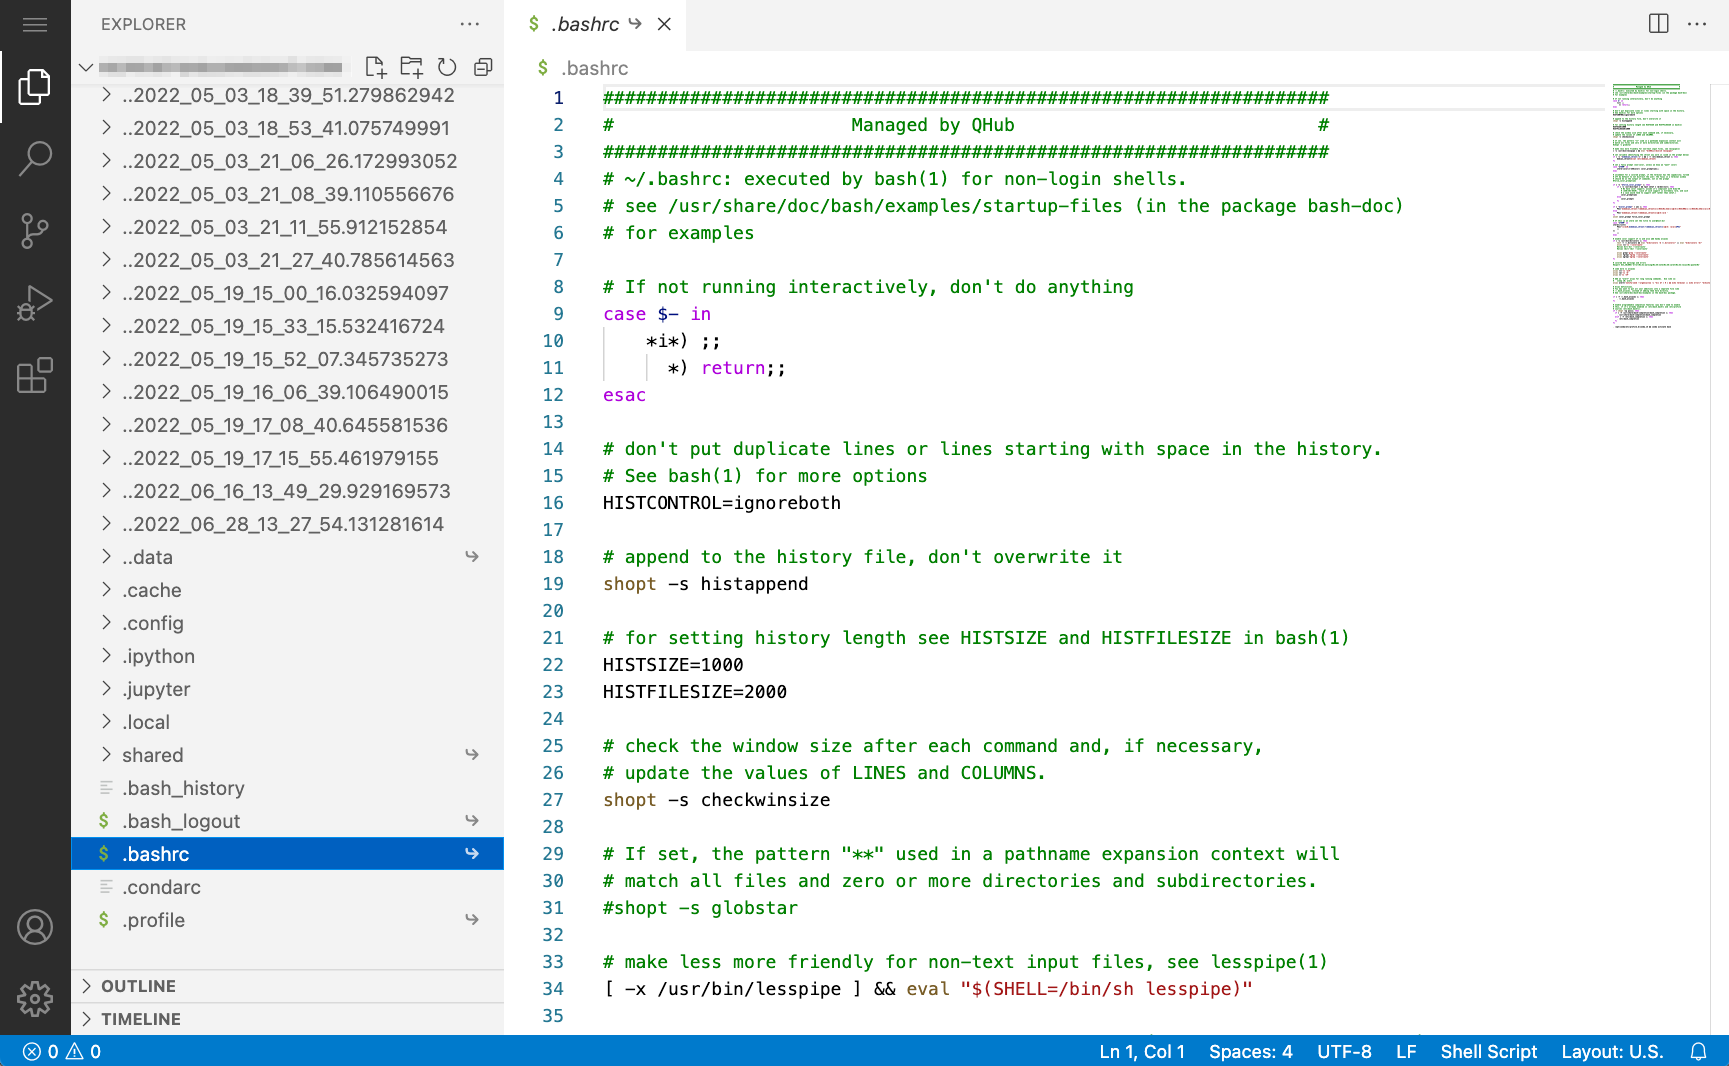
We now have an Editor window in which we can modify the file. The default
VS Code preferences include an auto-save feature which will continually save
the files as soon as you stop typing edits.
Adding extensions
Using the Activity Bar, navigate to the Extensions. The Explorer sidebar
now shows lists of Extensions, grouped by those installed by your admin, those
installed by you, and a list of "Popular" extensions you may want to try.
Through this interface we can also search the Marketplace for a particular
extension.
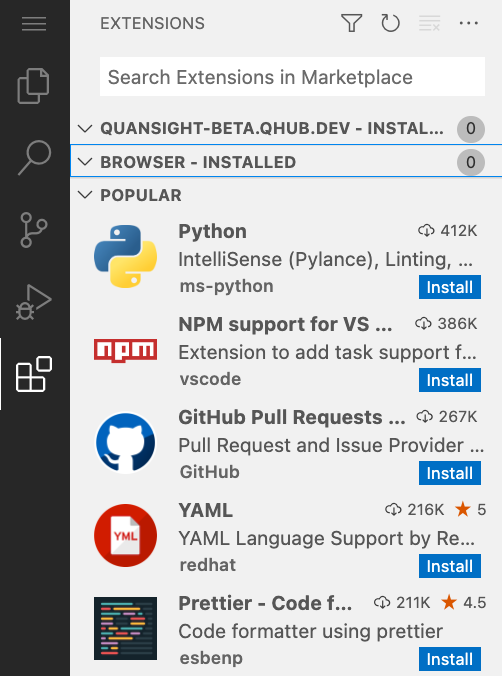
The Python extension is at the top of the list in our example (rightly so!), but if you don't see it here, you can search for it.
If you click on the Python extension, you'll see additional information about
this extension in the main window. This extension provides some extra tooling
around Python. It will allow us to select a Python environment and run and
debug code right inside of VS Code. Go ahead and click Install. It should
only take a few seconds to install.
Now let's run some code!
Running Python code
In the Explorer pane, selected the New File icon:
You can name it anything you'd like, here we've named it example.py. The
*.py extension let's VS Code know that it's a Python file, and you can set up
some automatic linting tasks through Preferences if you'd like.
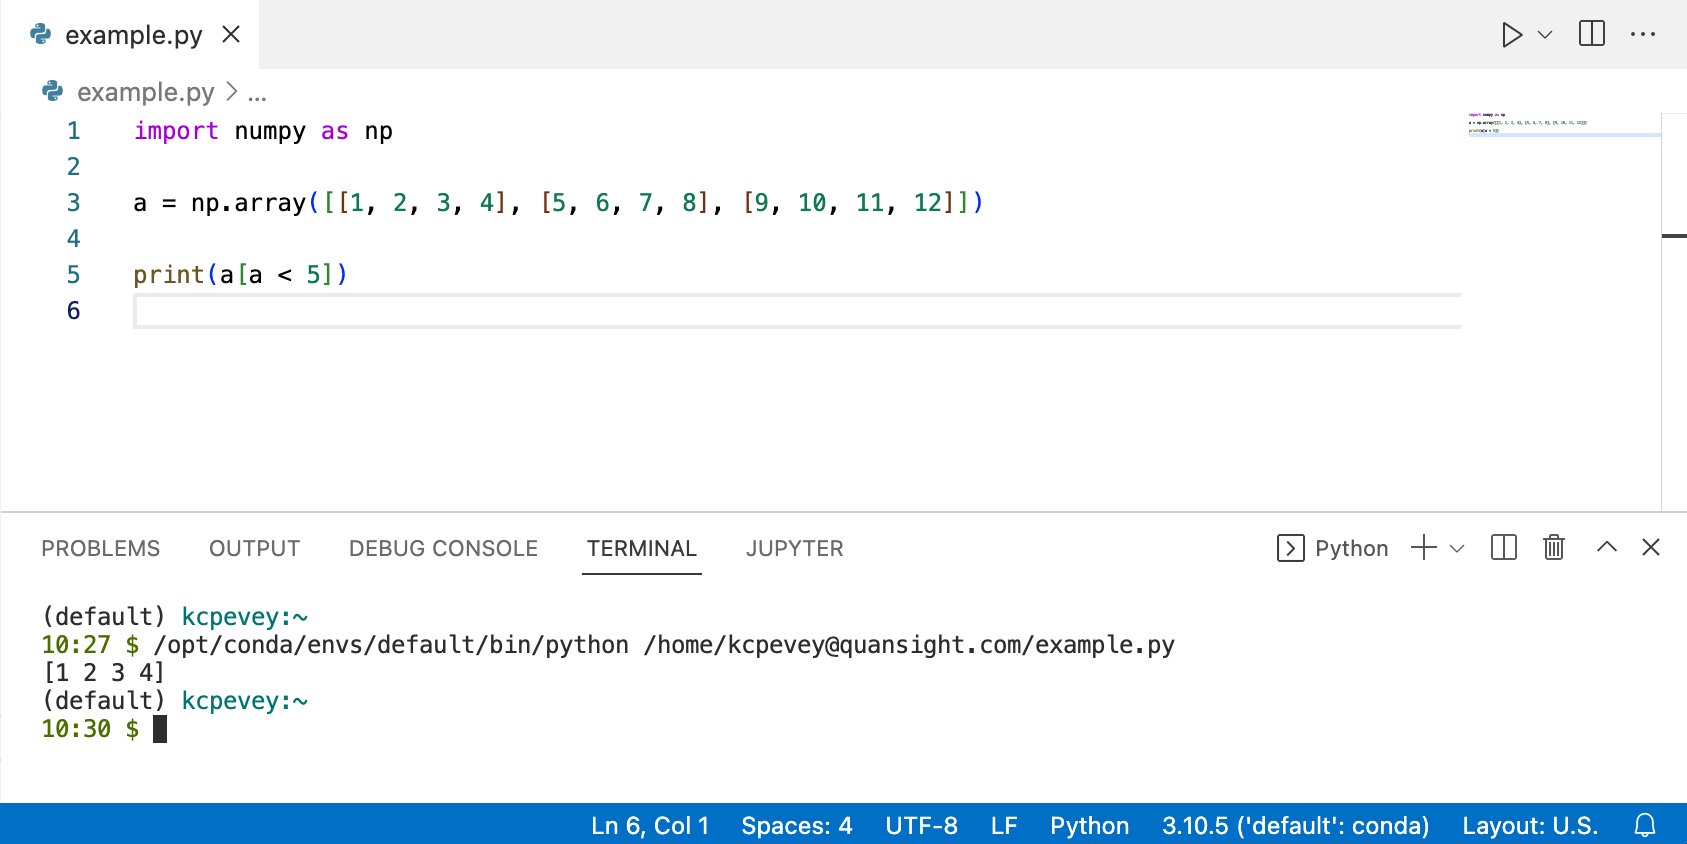
Add some sample code to your file:
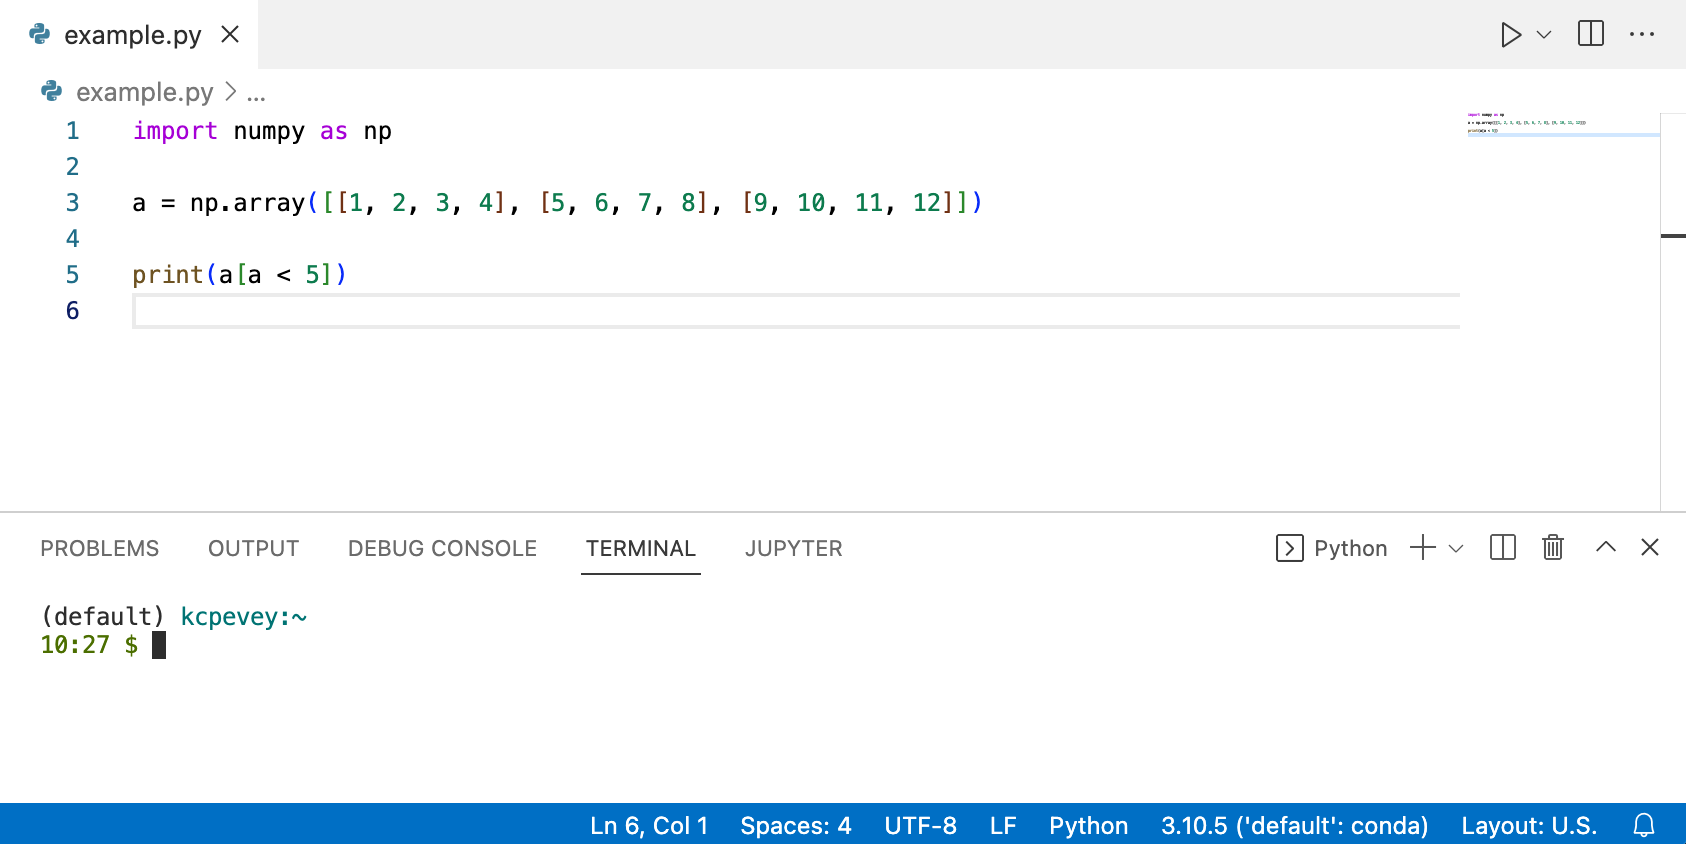
We also see the VS Code Terminal in the previous image. This can be
opened with File -> Terminal -> New Terminal.
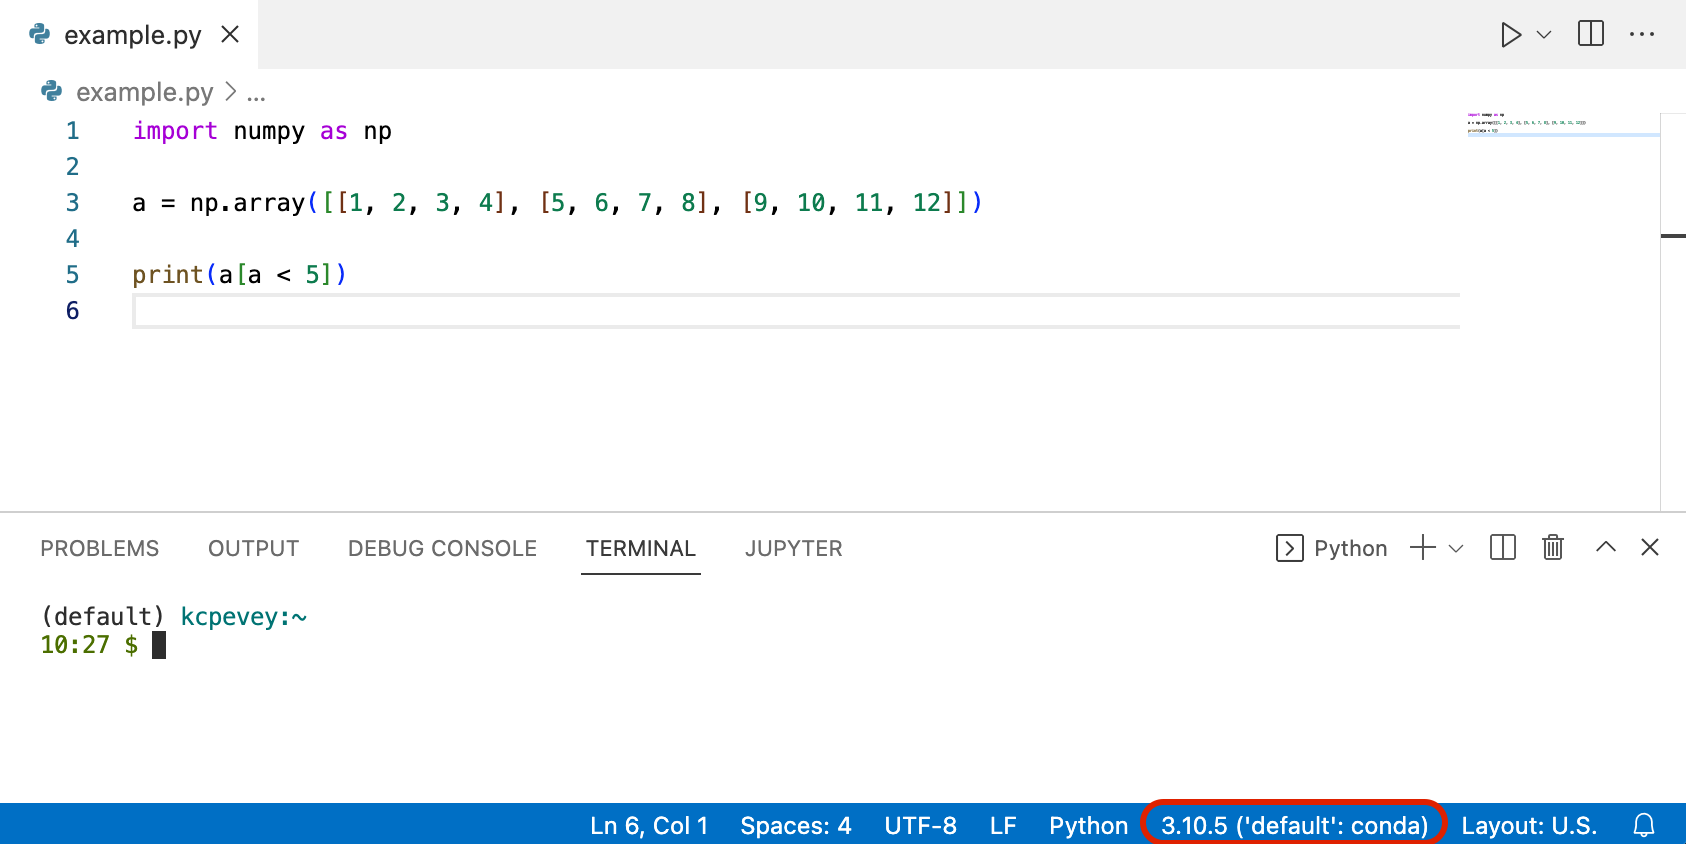
Before we run our file, we need to select what Conda environment it should run inside.
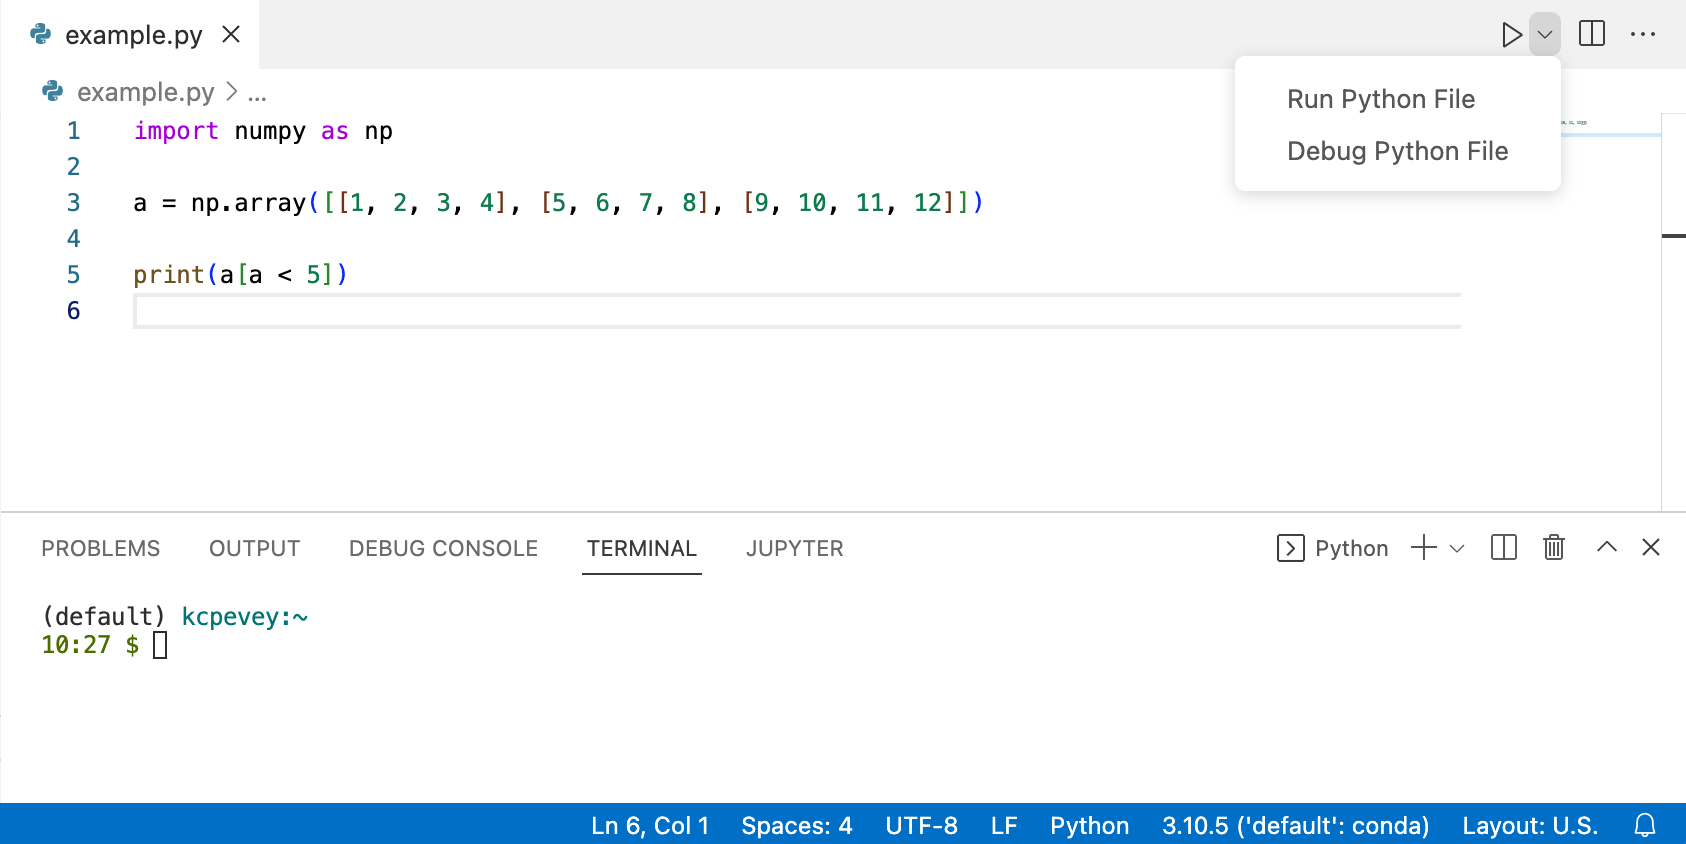
Now we can run our code through the VS Code UI by selecting either
Run Python File or Debug Python File in the top right.
We can see output in the terminal:
As another alternative, we could run code directly from the terminal as well.
Conclusion
We've covered the basic setup and run some arbitrary code. If you're curious about more advanced features or have specific questions, you can always refer back to the VS Code Documentation.