Debug Nebari deployment
The beauty of Nebari is that most Dev Ops management is already handled for you. However, there will likely come a time that you will need to debug your Nebari instance. This debug guide contains some tips and tricks to help you in your debug endeavors.
Generating the kubeconfig
A file that is used to configure access to clusters is called a kubeconfig file. This is a generic way of referring to configuration files in the Kubernetes context. Generally, it does not mean that there will be a file named kubeconfig present in your machine.
Generating the kubeconfig is an essential step to get started with kubectl, k9s or
any other kubernetes management tool. The kubeconfig file contains all the necessary
information for kubectl to communicate with a Kubernetes cluster, including the API
server address, authentication credentials, and cluster details. In this section, we
will cover the process of generating a kubeconfig file and updating it to allow
kubectl to access your Nebari Kubernetes cluster.
- Google GCP
- Amazon AWS
- Azure
- Local (Testing)
For Google GCP (also known as Google Cloud Platform or GCP), you'll need to have gcloud installed.
Next, install the gke-gcloud-auth-plugin component (this step will become
outdated once GKE (Google Kubernetes Engine) version 1.26 is released).
gcloud components install gke-gcloud-auth-plugin
To enable this plugin, you'll need to update gcloud by:
-
Set
export USE_GKE_GCLOUD_AUTH_PLUGIN=Truein~/.bashrc(or in Environment variables for Windows). -
Run the following command:
source ~/.bashrcFor Windows environments, start a new terminal.
-
Update gcloud to the latest version.
gcloud components update
Now you'll need to authenticate to GCP using:
gcloud auth login
Finally, you can generate the kubeconfig which will be used by k9s:
gcloud container clusters get-credentials <project-name>-<namespace> --region <region>
For Amazon Web Services (AWS),
you'll need to have the
AWS CLI
installed. The command to update your kubeconfig for AWS is:
aws eks update-kubeconfig --region <region> --name <project-name>-<namespace>
For Microsoft Azure,
you'll need to have the
azure CLI
installed. The command to update your kubeconfig for Azure is:
az aks get-credentials --resource-group <project-name>-<namespace> --name <project-name>-<namespace>
If you deployed manually from your local machine, the configuration file
kubeconfig will have been autogenerated during the nebari deploy process.
Getting started with kubectl
kubectl is a powerful tool that allows you to interact with Kubernetes clusters, view and modify cluster resources, and debug issues with your deployments. In this guide, we will cover how to install kubectl and use it to troubleshoot issues with your Nebari deployments.
Installing kubectl
Before proceeding, we need to make sure that kubectl is installed on your local machine. Here are some steps to validate its presence or related documentation on how to install it:
- Check if
kubectlis already installed on your machine by running the following command:
kubectl version --client
- If kubectl is not installed, you can download and install it following the instructions in the kubernetes documentation. The installation steps may vary depending on your operating system, so be sure to follow the instructions that apply to your system.
Using kubectl to debug Kubernetes deployments
Once you have installed kubectl, you can use it to debug issues within your Nebari Kubernetes cluster.
kubectl provides a variety of commands and options to help you diagnose and fix issues with your deployment.
In this section, we will cover some useful kubectl commands to get you started.
Viewing all pods in a namespace
To view all the pods in a namespace, use the following command:
kubectl get pods -n <namespace>
This command lists all the pods in the specified namespace. You can use the namespace flag (-n)
to specify the namespace you want to view.
Viewing all pods in all namespaces
To view the logs for a specific pod, use the following command:
kubectl logs <pod-name> -n <namespace>
Replace pod-name with the name of the pod you want to view logs for, and namespace with
the namespace the pod is deployed in. This command displays the logs for the specified pod.
Usually Nebari is deployed into the dev namespace, but you can double check the assigned
value by inspecting your nebari-config.yaml under the namespace key. For more information
refer to general configuration settings.
Viewing logs for a specific pod
kubectl exec -it <pod-name> -n <namespace> -- /bin/bash
Replace pod-name with the name of the pod you want to execute the command in, and namespace
with the namespace the pod is deployed in. This command opens a shell inside the specified pod,
allowing you to execute commands as if you were logged into the pod.
Troubleshooting
By default, kubectl looks for a file named config in the $HOME/.kube directory.
You can specify other kubeconfig files by setting the KUBECONFIG environment variable or
by setting the --kubeconfig flag. Generally, your cloud provider CLI will automatically
handle the kubeconfig directory reference for you.
For step-by-step instructions on creating and specifying kubeconfig files, see Configure Access to Multiple Clusters.
If you encounter issues connecting to your Nebari cluster using kubectl, ensure that your kubeconfig file is set up correctly. You can refer to the previous section on how to update your kubeconfig using the cloud provider CLI.
If you are still experiencing issues, check the logs for any error messages that may provide clues to the issue. You can also consider reaching out to the Nebari support team for assistance by creating an issue on the Nebari issues page.
Debugging the Kubernetes Cluster using k9s
If you need more information about your Kubernetes cluster,
k9s is a terminal-based UI that is extremely useful
for debugging. It simplifies navigating, observing, and managing your
applications in Kubernetes. k9s continuously monitors Kubernetes clusters
for changes and provides shortcut commands to interact with the observed
resources. It's a fast way to review and resolve day-to-day issues in
Kubernetes, a huge improvement to the general workflow, and a best-to-have
tool for debugging your Kubernetes cluster sessions.
Setting up k9s for Nebari
First, follow the installation instructions on the k9s documentation to install k9s on your local machine.
Getting started with k9s
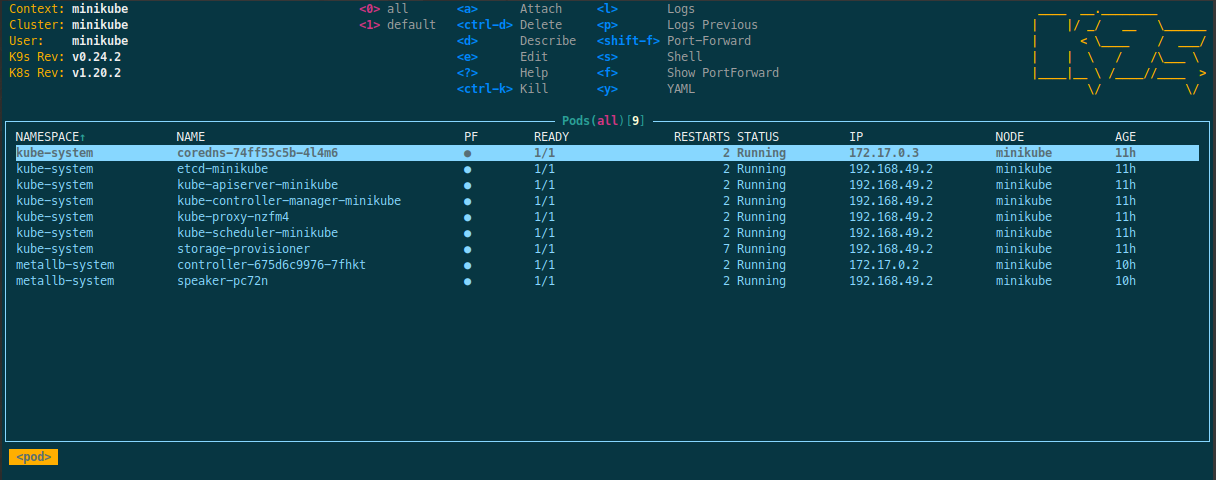
Launch k9s from a terminal on your local machine. It will look for the
configuration in the kubeconfig to dial the connection with the cluster.
$ k9s
To view all the current processes
Use the shortcut 0 (this may be the default).
Using k9s you can inspect any services launched by your cluster. For
example, if your cluster has problems with the network traffic tunnel
configuration, it may limit or block a user's access to destination resources
such as files or workers, using k9s you can inspect the network
configuration as well as the connection logs.
To debug processes running on pod
Use the arrow keys to navigate to a pod for your Nebari instance. Then, you can investigate the pod by clicking Enter or by typing the hotkey l.
Advanced k9s usage
From within k9s, the port-forward keystroke, shift + f, allows you to access and interact with your Kubernetes cluster from your local machine. You can then use this method to investigate issues and adjust your services locally without the need to expose them beforehand.
Let's suppose you are deploying a new service to Nebari, and would like to
quickly debug any connection related problems around it, for example a 404 Error. With port-forwarding you can attest if the origin of the problem
lies within the service itself or with the networking aspects of the
connection, for example an Ingress route misconfiguration. This allows you to
check the service status without any extra modifications to its
structure.
Troubleshooting
If your k9s instance fails to connect to your cluster, ensure that you have the authentication set up properly. k9s may give you a warning similar to: "Dial K9s Toast [X/5]".
If your k9s instance closes for unknown reasons, you can check the k9s logs. You can specify where your log file is located by:
k9s --logFile string
or you can inspect the default temporary directory by looking up the logFile
attribute description in k9s --help.